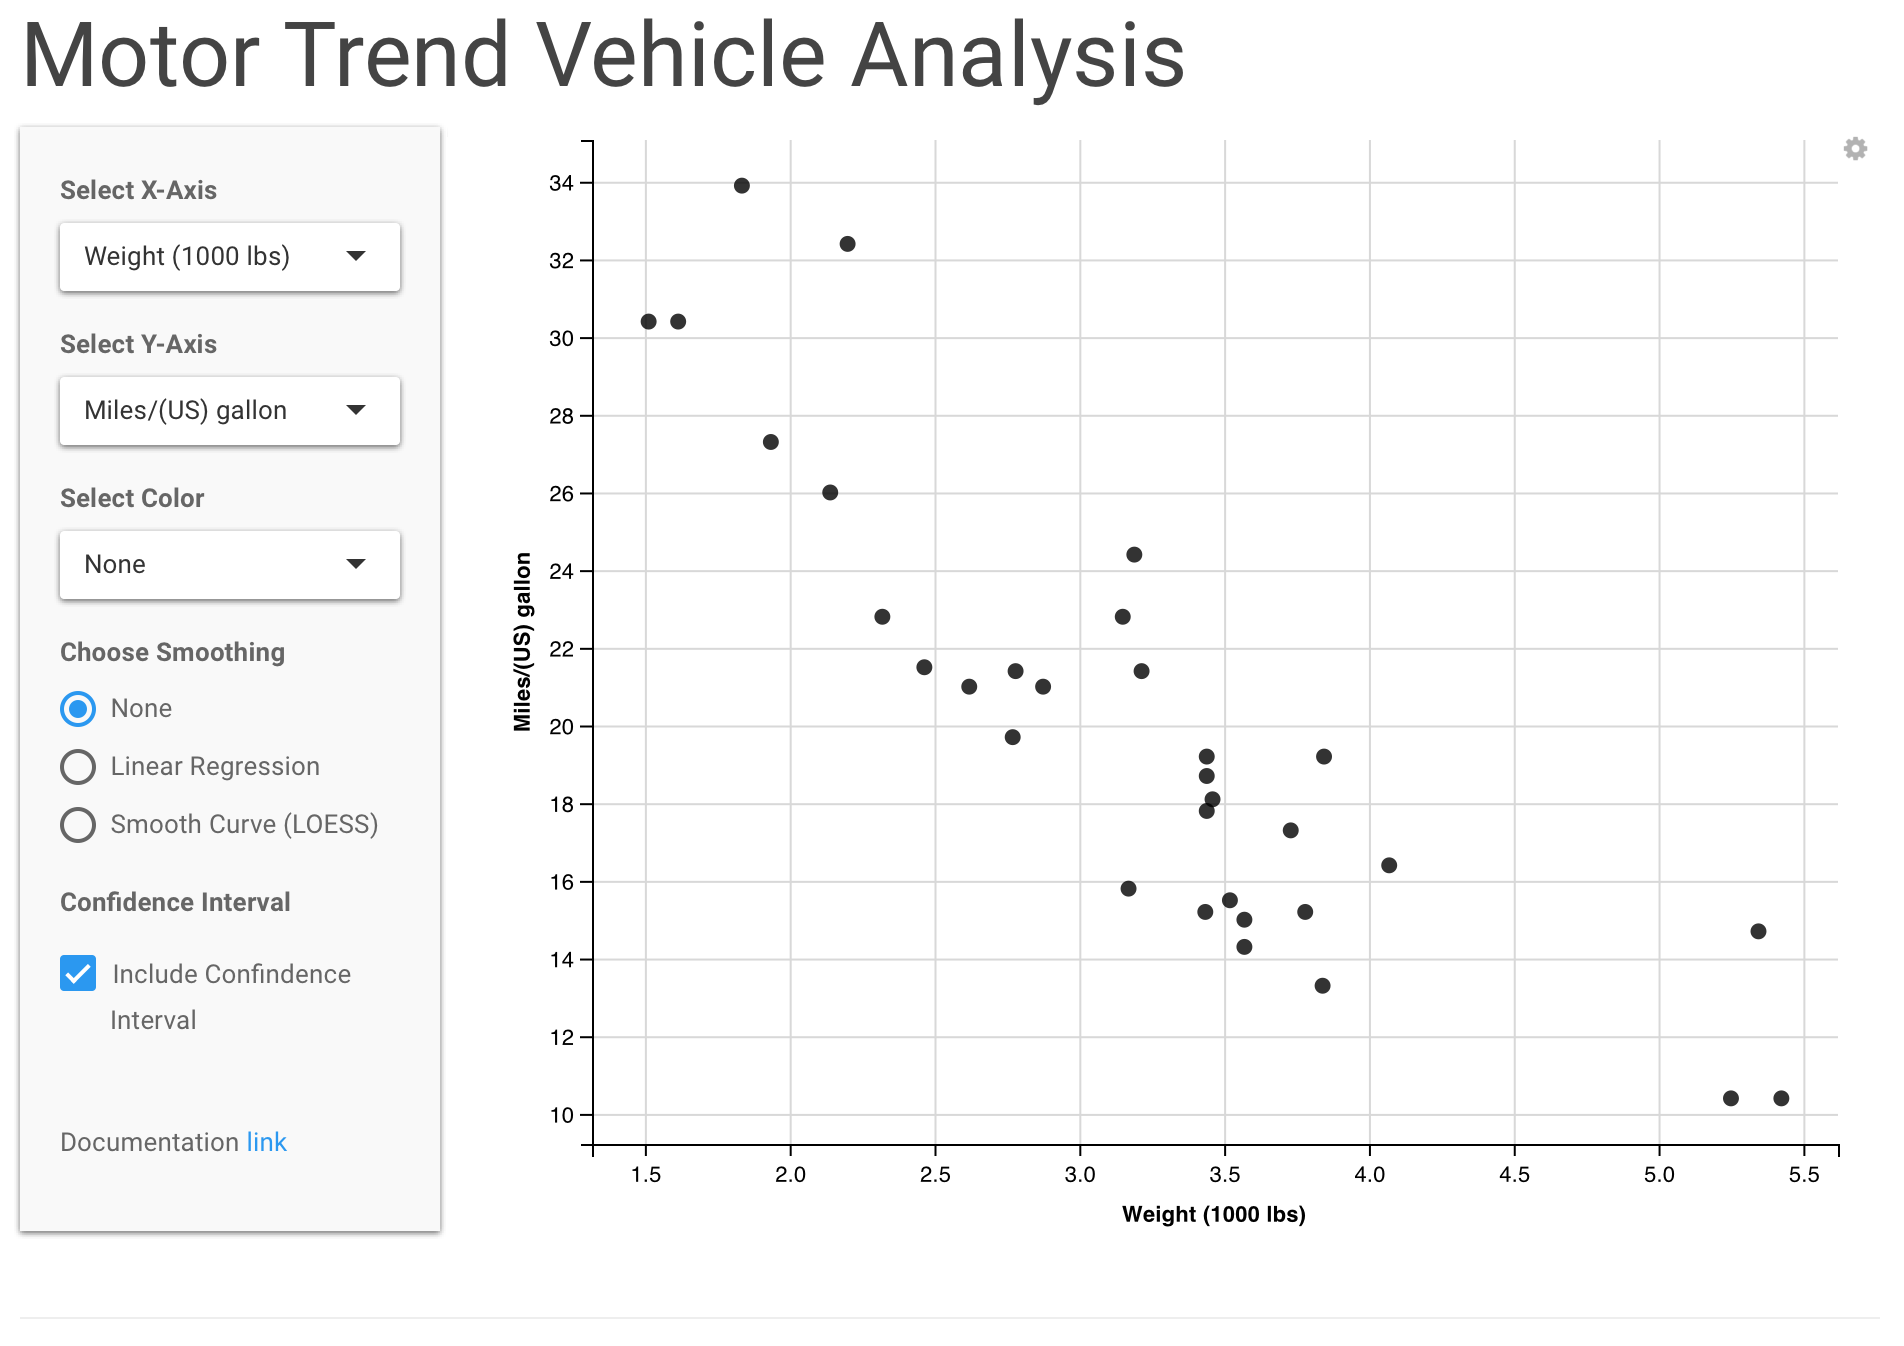
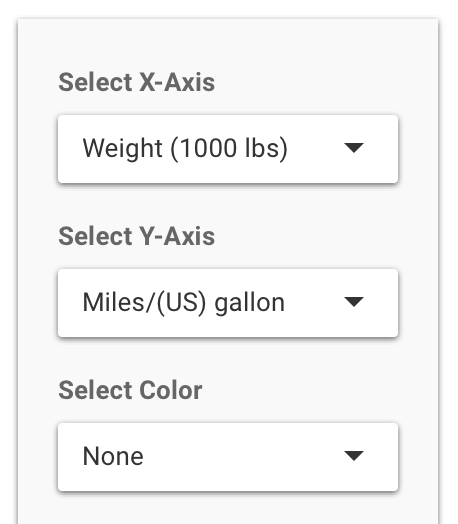
Select Axes & Color
In the sidebar panel on the upper left of the app there are three dropbown boxes titled: Select X-Axis, Select Y-Axis, and Select Color. Each dropdown contains a list of all eleven variables of the mtcars dataset. Selecting a variable from the dropdown list changes the respective feature on the chart instantaneously.
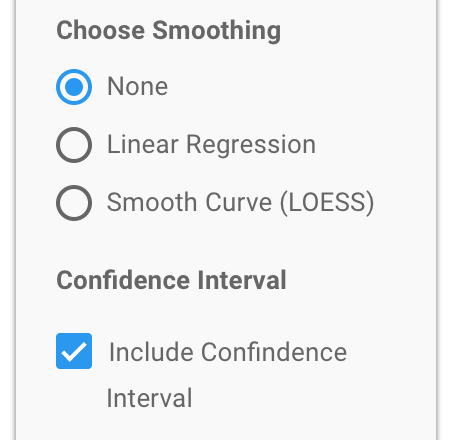
Choose Smoothing
In the sidebar panel on the middle left of the app under the heading Choose Smoothing are three radio buttons. The default value is None. The second option Linear Regresssion adds a linear regression line with a confidence interval are to chart. The third toption Smooth Curve (LOESS) adds a smooth curve line through the data points.
Below the Choose Smoothing radio buttons is a section heading Confidence Interval with a single checkbox. This turns the confidence interval shading area on and off around the smoothing line.